The OECD has just released its new Business and Finance Outlook for 2015. A lot of interesting stuff there. We'll want to take a closer look at the discussion of the problems that low interest rates pose for pension funds and insurance companies -- I've thought for a while that this is the most convincing form of the "reaching for yield" argument. But what I want to talk about now is the OECD's apparent endorsement of the "disgorge the cash" thesis.
Chapter 2, "Corporate Investment and the Stagnation Puzzle," has a very interesting discussion of shareholder activism and its effects on investment. The starting point is the puzzle that while participants in financial markets are willing to accept unprecedentedly low returns, the minimum returns on new investment projects remain high, as evidenced by depressed real investment despite sustained low interest rates. I think this apparent puzzle is, precisely, a rediscovery of Keynes' liquidity premium. (Perhaps I will return to this in a subsequent post.) There are a number of ways to think about this, but one dimension is the pressure corporate managers face to avoid investment projects unless the returns are rapid, large, and certain.
Stock markets currently reward companies that favour dividends and buybacks and punish those that undertake more investment … which creates higher hurdle rates for investment.Here in one sentence is the disgorge the cash argument.
Private sector companies in market-based economies allocate capital spending according to shareholder value. Earnings may be retained for capital spending and growth, but only if the return on equity exceeds the cost of equity. If this is not the case then … they will choose to use their operating cash flow in other ways (by issuing dividends, carrying out cash buybacks…) … and in the limit may close plants and shed labor.The bolded sentence is puzzling. Is it description or prescription? (Or description of a prescription?) The rest of the section makes no sense if you think either that this is how corporate investment decisions are made, or if you think it's how they should be made. Among other reasons, once we have different, competing discount rates, the "return on equity" no longer has a well-defined value, even in principle. Throughout, there's a tension between the language of economic theory and the language of concrete phenomena. Fortunately the latter mostly wins out.
The last decade has seen the rising importance of activist investors who gain the support of other investors and proxy advisors to remove management, to gain influential board seats and/or to make sure that company strategy is in the best interest of shareholders… The question arises as to whether the role of such investors is working to cause short-termism strategies [sic] at the expense of long-term investment, by effectively raising the hurdle rate… Activists… favour the short-term gratification of dividends and share buybacks versus longer-term investment. Incumbent managers will certainly prefer giving in to shareholders desire for more ‘yield’ in a low-interest world to taking on the risk of uncertain long-term investment that might cause them to be punished in the share market. ...
To test this idea, an index of CAPEX/(CAPEX + Dividends & Buybacks) was created for each company, and the following investment strategy was measured: sell the highest quartile of the index (capital heavy firms) and buy the lowest quartile of the index (Dividend and Buyback heavy firms). … Selling high capital spending companies and buying low CAPEX and high buyback companies would have added 50% to portfolio values in the USA, 47% in Europe, 21% in emerging economies and even 12% in Japan (where activists play little role). On balance there is a clear investor preference against capital spending companies and in favor of short-termism. This adds to the hurdle rate faced by managers in attempting to undertake large capital spending programmes — stock market investors will likely punish them. … it would be fairly logical from a management point of view to return this cash to shareholders rather than undertake uncertain long-term investment projects... The risks instead would be born more by host-country investment in capacity and infrastructure.This is a useful exercise. The idea is to look at the ratio of investment to shareholder payouts, and ask how the stock price of the high-investment firms performed compared to the high-payout firms, over the six years 2009 through 2014. What they find is that the shares of the high-payout firms performed considerably better. This is important because it undermines the version of the disgorge argument you get from people like Bill Lazonick, in which buybacks deliver a short-term boost the share price that benefits CEOs looking to cash in on their options, but does nothing for longer-term investors. In Lazonick's version of the story, managers are on one side, shareholders, workers and the rest of society on the other. But if high-payout firms perform better for shareholders over a six-year horizon (which in financial-market terms is almost geologically long term) then we have to slice things differently. On one side are shareholders and CEOs, on the other are us regular people.
The other thing that is notable here is the aggregating of dividends and buybacks in a single "shareholder payout" term. This is what I do, I think it's unambiguously the right thing to do, but in some quarters for some reason it's controversial. So I'm always glad to find another authority to say, a buyback is a dividend, a dividend is a buyback, the end.
Another way to see these two points is to think about so-called dividend recapitalizations. These are when a private equity firm, having taken control of a business, has it issue new debt in order to fund a special dividend payment to themselves. (It's the private equity firm that's being recapitalized here, not the hapless target firm.) The idea of private equity is that the acquired firm will be resold at a premium because of the productive efficiencies brought about by new management. The more or less acknowledged point of a dividend recap is to allow the private equity partners to get their money back even when they have failed to deliver the improvements, and the firm cannot be sold at a price that would allow them to recoup their investment. Dividend recaps are a small though not trivial part of the flow of payments from productive enterprises to money-owners, in recent years totaling between 5 and 10 percent of total dividends. For present purposes, there are two especially noteworthy things about them. First, they are pure value extraction, but they take the form of a dividend rather than a share repurchase. This suggests that if the SEC were to crack down on buybacks, as people Lazonick suggest, it would be easy for special dividends to take their place. Second, they take place at closely held firms, where the managers have been personally chosen by the new owners. It's the partners at Cerberus or Apollo who want the dividends, not their hired guns in the CEO suites. It's an interesting question why the partners want to squeeze these immediate cash payments out of their prey when, you would think, they would just reduce the sale price of the carcass dollar for dollar. But the important point is that here we have a case where there's no entrenched management, no coordination problems among shareholders -- and Lazonick's "downsize-and-distribute" approach to corporate finance is more pronounced than ever.
Back to the OECD report. The chapter has some useful descriptive material, comparing shareholder payouts in different countries.
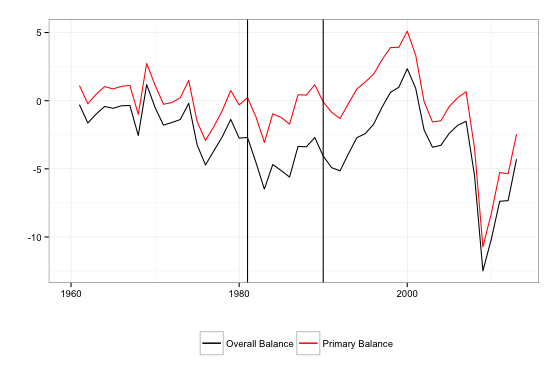
[In the United States,] dividends and buybacks are running at a truly remarkable pace, even greater than capital expenditure itself in recent years. There has been plenty of scope to increase capital spending, but instead firms appear to be adjusting to the demands of investors for greater yield (dividends and buybacks). … [In Europe] dividends and buybacks are only half what United States companies pay … While there is no marked tendency for this component to rise in the aggregate in Europe, companies in the United Kingdom and Switzerland … do indeed look very similar to the United States, with very strong growth in buybacks. … [In Japan] dividends and buybacks are minuscule compared with companies in other countries. …Here, for the US, are shareholder payouts (gray), investment (dark blue), and new borrowing (light blue, with negative values indicating an increase in debt; ignore the dotted "net borrowing" line), all given as a percent of total sales. We are interested in the lower panel.

As you can see, investment is quite stable as a fraction of sales. Shareholder payouts, by contrast, dropped sharply over 2007-2009, and have since recovered even more strongly. Since 2009, US corporations have increased their borrowing ("other financing") by about 4 percent of sales; shareholder payouts have increased by an almost exactly equal amount. This is consistent with my argument that in the shareholder-dominated corporation, real activity is largely buffered from changes in financial conditions. Shifts in the availability of credit simply result in larger or smaller payments to shareholders. The OECD report takes a similar view, that access to credit is not an important factor in variation in corporate investment spending.
The bottom line, though the OECD report doesn't quite put it this way, is that wealth-owners strongly prefer claims on future income that take money-like forms over claims on future incomes exercised through concrete productive activity. [1] This is, again, simply Keynes' liquidity premium, which the OECD authors knowing or unknowingly (but without crediting him) summarize well:
It was noted earlier that capital expenditures appear to have a higher hurdle rate than for financial investors. There are two fundamental reasons for this. First, real investors have a longer time frame compared to financial investors who believe (perhaps wrongly at times) that their positions can be quickly unwound.From a social standpoint, therefore, it matters how much authority is exercised by wealth-owners, who embody the "M" moment of capital, and how much is exercised by the managers or productive capitalists (the OECD's "real investors") who embody its "P" moment. [2] Insofar as the former dominate, fixed investment will be discouraged, especially when its returns are further off or less certain.
Second, managers … operate in a very uncertain world and the empirical evidence … suggests that equity investors punish companies that invest too much and reward those that return cash to investors. If managers make an error of judgement they will be punished by activist investors and/or stock market reactions … hence they prefer buybacks.Finally, it's interesting what the OECD says about claims that high payouts are simply a way for financial markets to reallocate investment spending in more productive directions.
It is arguable that if managers do not have profitable projects, it makes sense to give the money back to investors so that they can reallocate it to those with better ideas. However, the evidence … suggests that the buyback phenomenon is not associated with rising productivity and better returns on equity.Of course this isn't surprising. It's consistent with the academic literature on shareholder activism, and on the earlier takeover wave, which finds success at increasing payments to shareholders but not at increasing earnings or productive efficiency. For example, this recent study concludes:
We did not see evidence that targets’ financials improved... The targets’ leverage and payout, however, did seem to increase, suggesting that the activists are unlocking value by prompting management to return additional cash to shareholders.Still, it's noteworthy to see a bastion of orthodoxy like the OECD flatly stating that shareholder activism is pure extraction and does nothing for productivity.
UPDATE: Here's James Mackintosh discussing this same material on "The Short View":
[1] It's worth mentioning here this interesting recent Australian survey of corporate executives, which found that new investment projects are judged by a minimum expected return or hurdle rate that is quite high -- usually in excess of 10 percent -- and not unresponsive to changes in interest rates. Even more interesting for our purposes, many firms report that they evaluate projects not based on a rate of return but on a payback period, often as short as three years.
[2] The language of "M and "P" moments is of course taken from Marx's vision of capital as a process of transformation, from money to commodities to authority over a production process, back to commodities and finally back to money. In Capital Vol. 1 and much of his other writing, Marx speaks of the capitalist as straightforwardly the embodiment of capital, a reasonable simplification given his focus there and the fact that in the 1860s absentee ownership was a rare exception. There is a much more complex discussion of the ways in which the different moments of capital can take the form of distinct and possibly conflicting social actors in Capital Vol. 3, Part 5, especially chapter 27.